Run and Debug Dll
Introduction
A DLL is a library that contains functions/code and datato to be used by more than one program at the same time, unlike normal programs it does not contain a main function therefore it does not have an entry point for execution.
However, there are various reasons to execute a DLL, for example to solve a CTF, to analyze a DLL dropped by malware or to understand how it works.
Run DLL
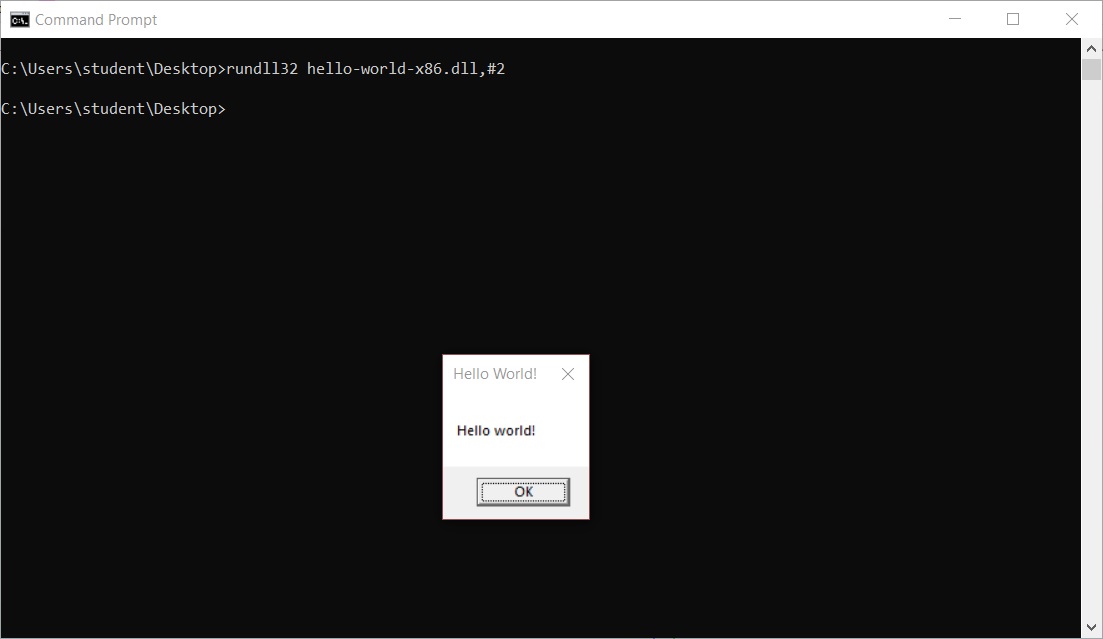
To run any DLL I have to use rundll program in my case I am using rundll32 because the DLL is x86. So in order to run a DLL I have to execute the command rundll32 hellow-world-x86.dll,#2 where #2 is the number of exports.
After the execution, a popup with the message Hello world will appear.
Debug DLL
In order to dynamically debug the DLL I am going to use IDA Free and as I see trying to run it as usual does not work at all.
Now to run and debug the DLL properly I open two IDA windows, one with the DLL in static analysis and another in dynamic analysis running the DLL via rundll32 program in IDA.
Now I open another IDA window and open rundll32 which is in the path C:\Windows\SysWOW64\rundll32.exe to dynamically analyse my DLL and leave the other IDA window in static analysis in the background (for now).
If this error message appears press “Yes”, it means I have to choose a different path to save the IDA databases for future analysis and I usually choose my Desktop.
At this point, I have to tell the rundll32 loaded in IDA to execute my hello-world-x86.dll.
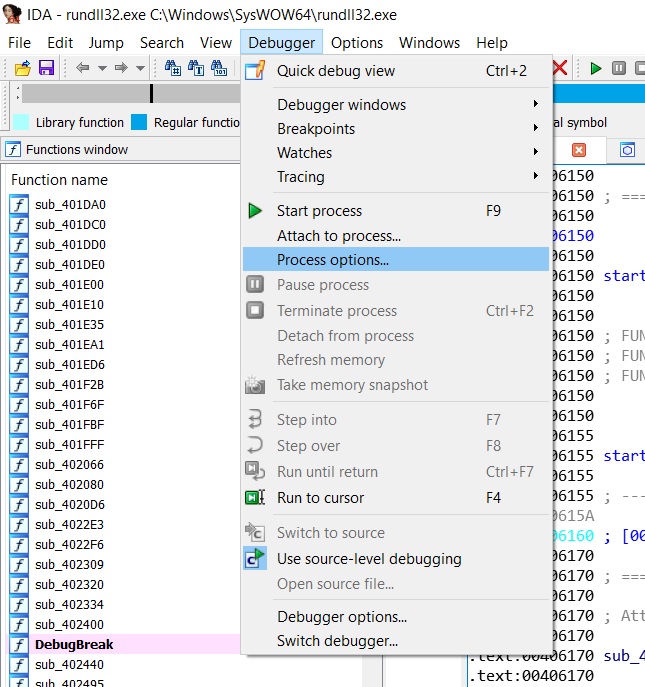
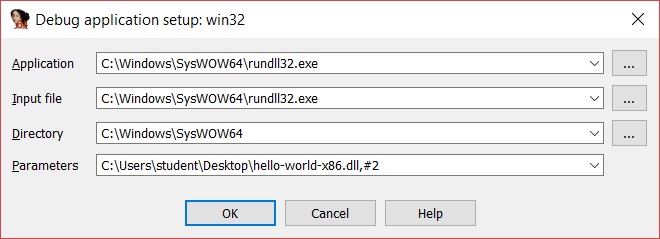
and a window will pop up where I can insert the parameters that rundll32 take which are the name of the DLL to run and its parameters similar to when I executed in the shell, but with the only difference that I have to put the full path of the DLL.
Once set the parameters I have to set the debugger in order to stop at each load and unload of library in this way as soon as my DLL is loaded the process will stop without continuing to go on, at that point I can begin to analyze the DLL's code.
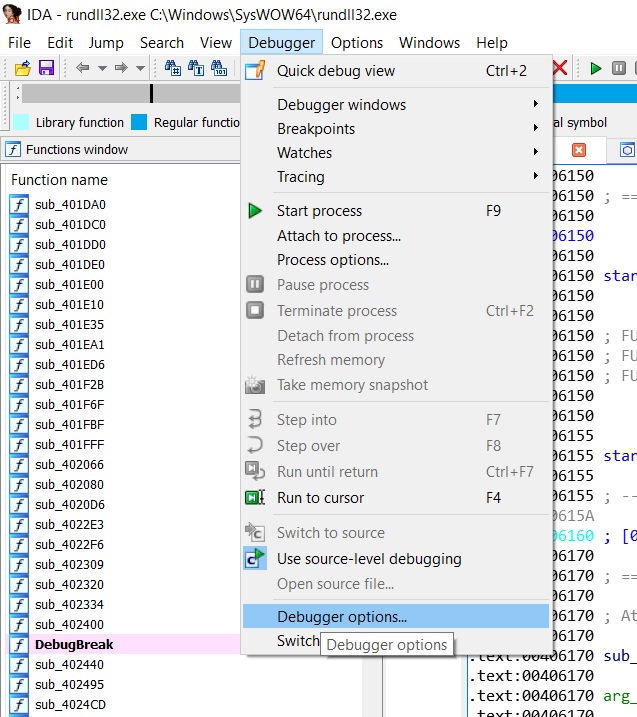
At the “Debugger setup” windows I have to check “Suspend on library load/unload” in the “Event” section, and “Library load/unload” in “Logging” section.
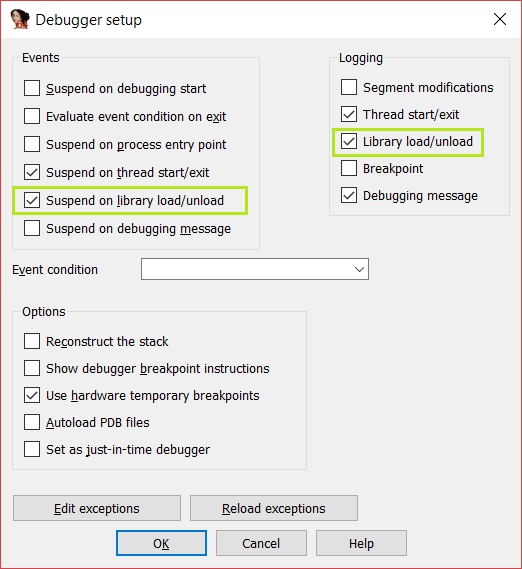
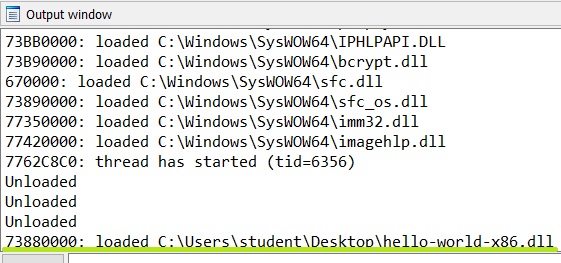
By enabling logging on load/unload operation I can see what libraries are loading and unloading and when my DLL is being loaded. Now I start debugging by pressing the play button.
I can see the libraries start loading and each time a library is loaded it stops so I have to keep pressing play every time until my library (hello-world-x86.dll) is loaded.
After quite a lot my DLL get loaded.
Now to see at what address the library is loaded I have to look at the “Modules List” window, if the Windows is not there I can open it.
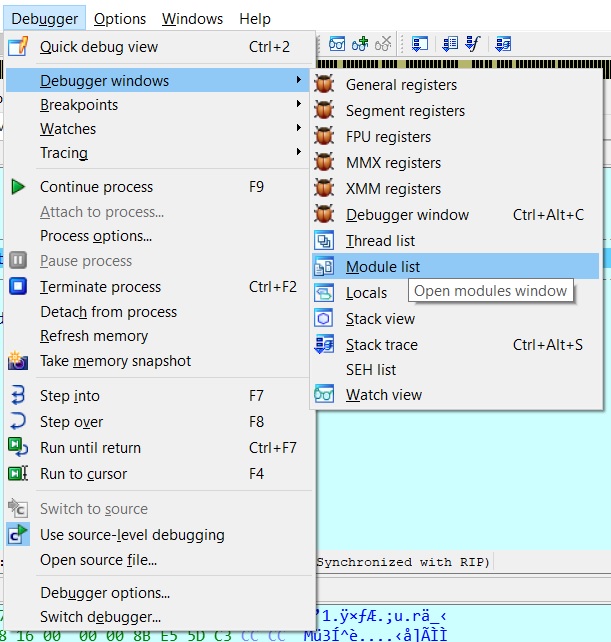
In my case, the library has been loaded at 73670000.
If ASLR is on at every run the DLL will be loaded in a different address so in order to match the address from the IDA window of static analysis (which starts at 10001000) with the dynamic analysis one

I have to rebase the IDA window in static analysis in order to let it start from 73670000 instead of 10001000.
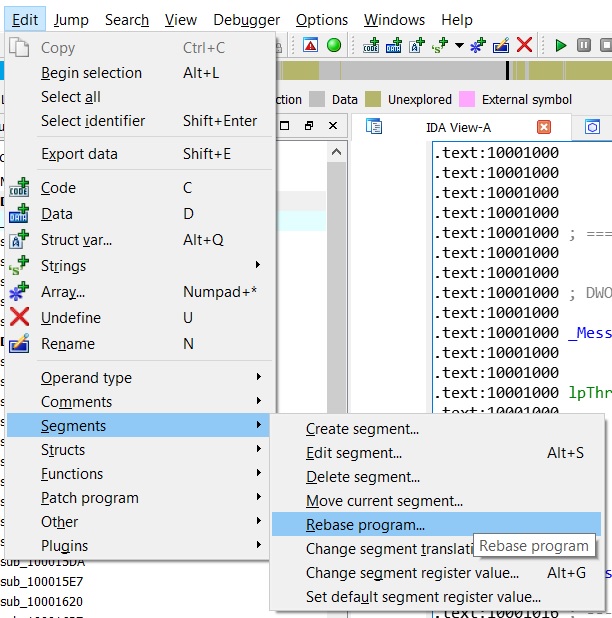
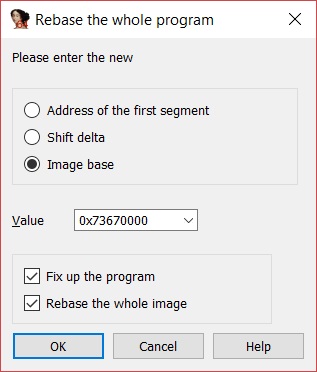
The rebased program address has now changed.

At this point I am stopped right after the dynamic IDA window loaded my DLL, I select any line of code and press “G” to jump in a specific address. The address where I wan to to jump is the one I found after rebasing my DLL in the stacic view of IDA which is 73671000 and I will jump in the desired portion of the code I want to debug.
In this way I can find by using the static view any portion of the code of the DLL, put a breakpoint, jump there and debug by executing it step by step.
